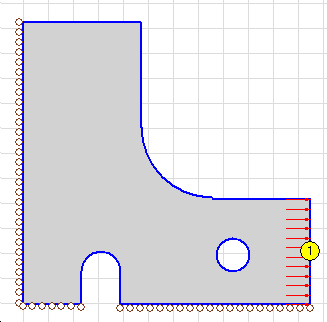
Figure 1. Geometry and loading of Plate
A part "Plate" was analysed using the Concept Analyst software (version 1.9). The geometry and loading are presented in figure 1. The maximum von Mises stress in the model is 374.73 MPa, and a stress concentration factor of 3.75 may be defined as the most tensile principal stress divided by the only applied traction.
The background grid size in figure 1 is 5 mm, so that the overall dimensions of the part are 57.49 mm horizontally by 56.41 mm vertically. The loads are as follows, referring to the lines indicated by the numbers in circles in figure 1:
1: Uniformly distributed load (traction) of 100 MPa
Distributed loads applied as tractions perpendicular to the edge geometry are simple uniformly distributed loads. Tractions tangential to the edge geometry apply a shear stress of the specified value. For tractions in other orientations, consult the Concept Analyst documentation for interpretation.
Rollers boundary conditions prescribe zero displacement in the direction perpendicular to the line on which they are applied.
The Concept Analyst model was untitled when this report file was opened for writing.
The part "Plate" was modelled as a two-dimensional problem in plane stress. Mild Steel was selected as the material, having properties:
Young's modulus : 207 GPaA linear elastic assumption is made.
Poisson's ratio : 0.30
Yield stress : 280 MPa
Figure 2 shows the deformed and undeformed shape for the part. The undeformed shape is shown in the thicker, blue line, while the deformed shape is shown in the thinner, red line. The deformation has been exaggerated for clarity.
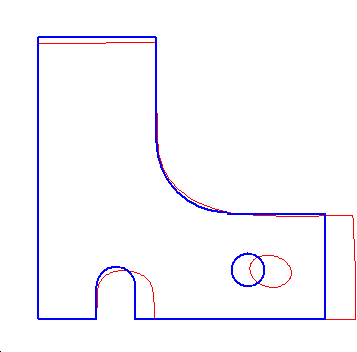
Figure 3 shows a contour plot of the maximum principal stresses in the part. The peak (i.e. most positive/tensile) value of maximum principal stress occurs at the point marked with a circle in figure 3 and takes the value 374.73 MPa.
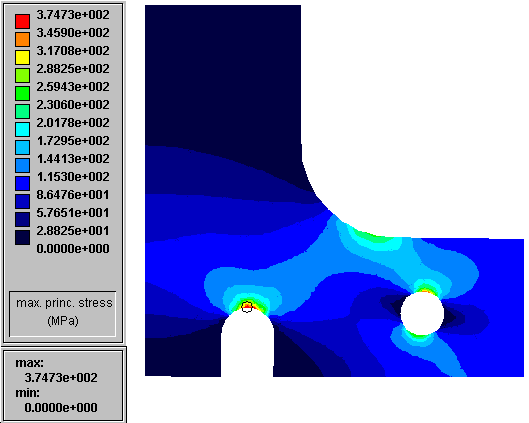
Figure 4 shows a contour plot of the displacement in the part in the x-direction. The peak value of this displacement component occurs at the point marked with a circle in figure 4 and takes the value 0.0349 mm.
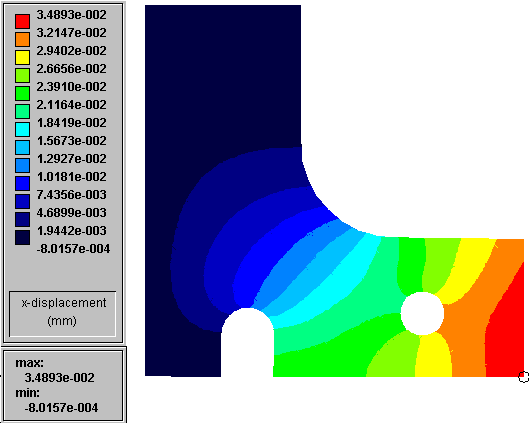
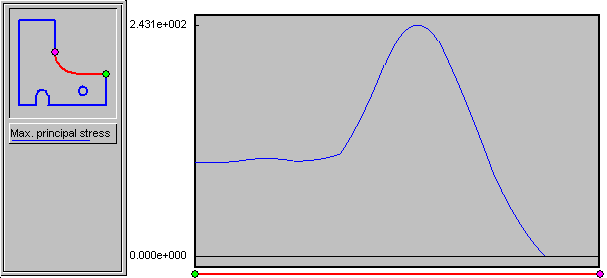
Figure 5 shows a graph of results over the section of boundary highlighted in red in the small geometric representation in the figure.
The part is fine.